One idea, three moves
Most predictive-maintenance tools force a trade-off: a proprietary sensor you are locked into, a black-box score no engineer trusts, or an offline reliability spreadsheet with no live data. Bluestream refuses the trade-off — ingest anything, reason against standards, act in your own CMMS.
Any existing sensor or PLC over OPC UA, Modbus, MQTT or I²C. No proprietary hardware, no rip-and-replace.
Anchored in industry reliability data and ISO 14224 failure modes — a credible answer from day one, not after months of training.
Every finding becomes a criticality-ranked, failure-mode-labelled job in your CMMS. The loop closes.
It opens on what needs you today
The dashboard does not greet you with a wall of gauges. It opens on a single queue — what to act on first — ordered the way NORSOK Z-008 prioritises corrective work: each case gets a priority from its consequence class and a due date, which comes forward when a trend will reach its limit sooner. Healthy assets collapse out of the way.
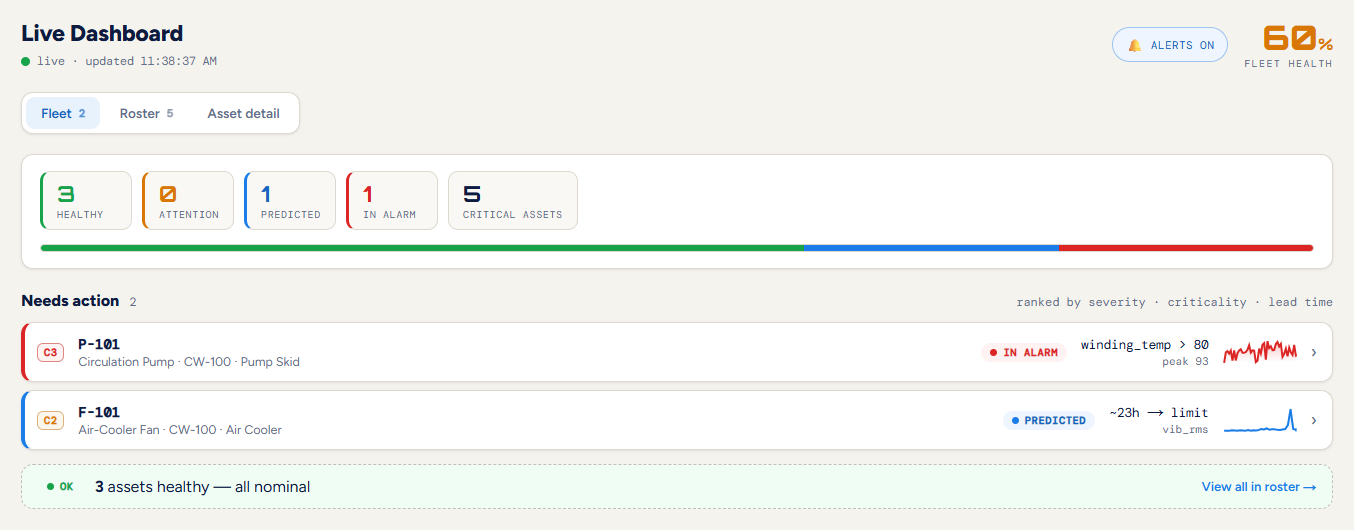
You start with the two assets that actually need you today. Alert fatigue is the number-one reason maintenance teams end up tuning predictive tools out — so the queue is short by design, and everything healthy stays folded away.
It shows its work
Open the predicted asset and there is no spectrum plot to interpret. There is a plain-language verdict, the signals that produced it, and the reasoning behind the number — assembled end to end, on one screen.
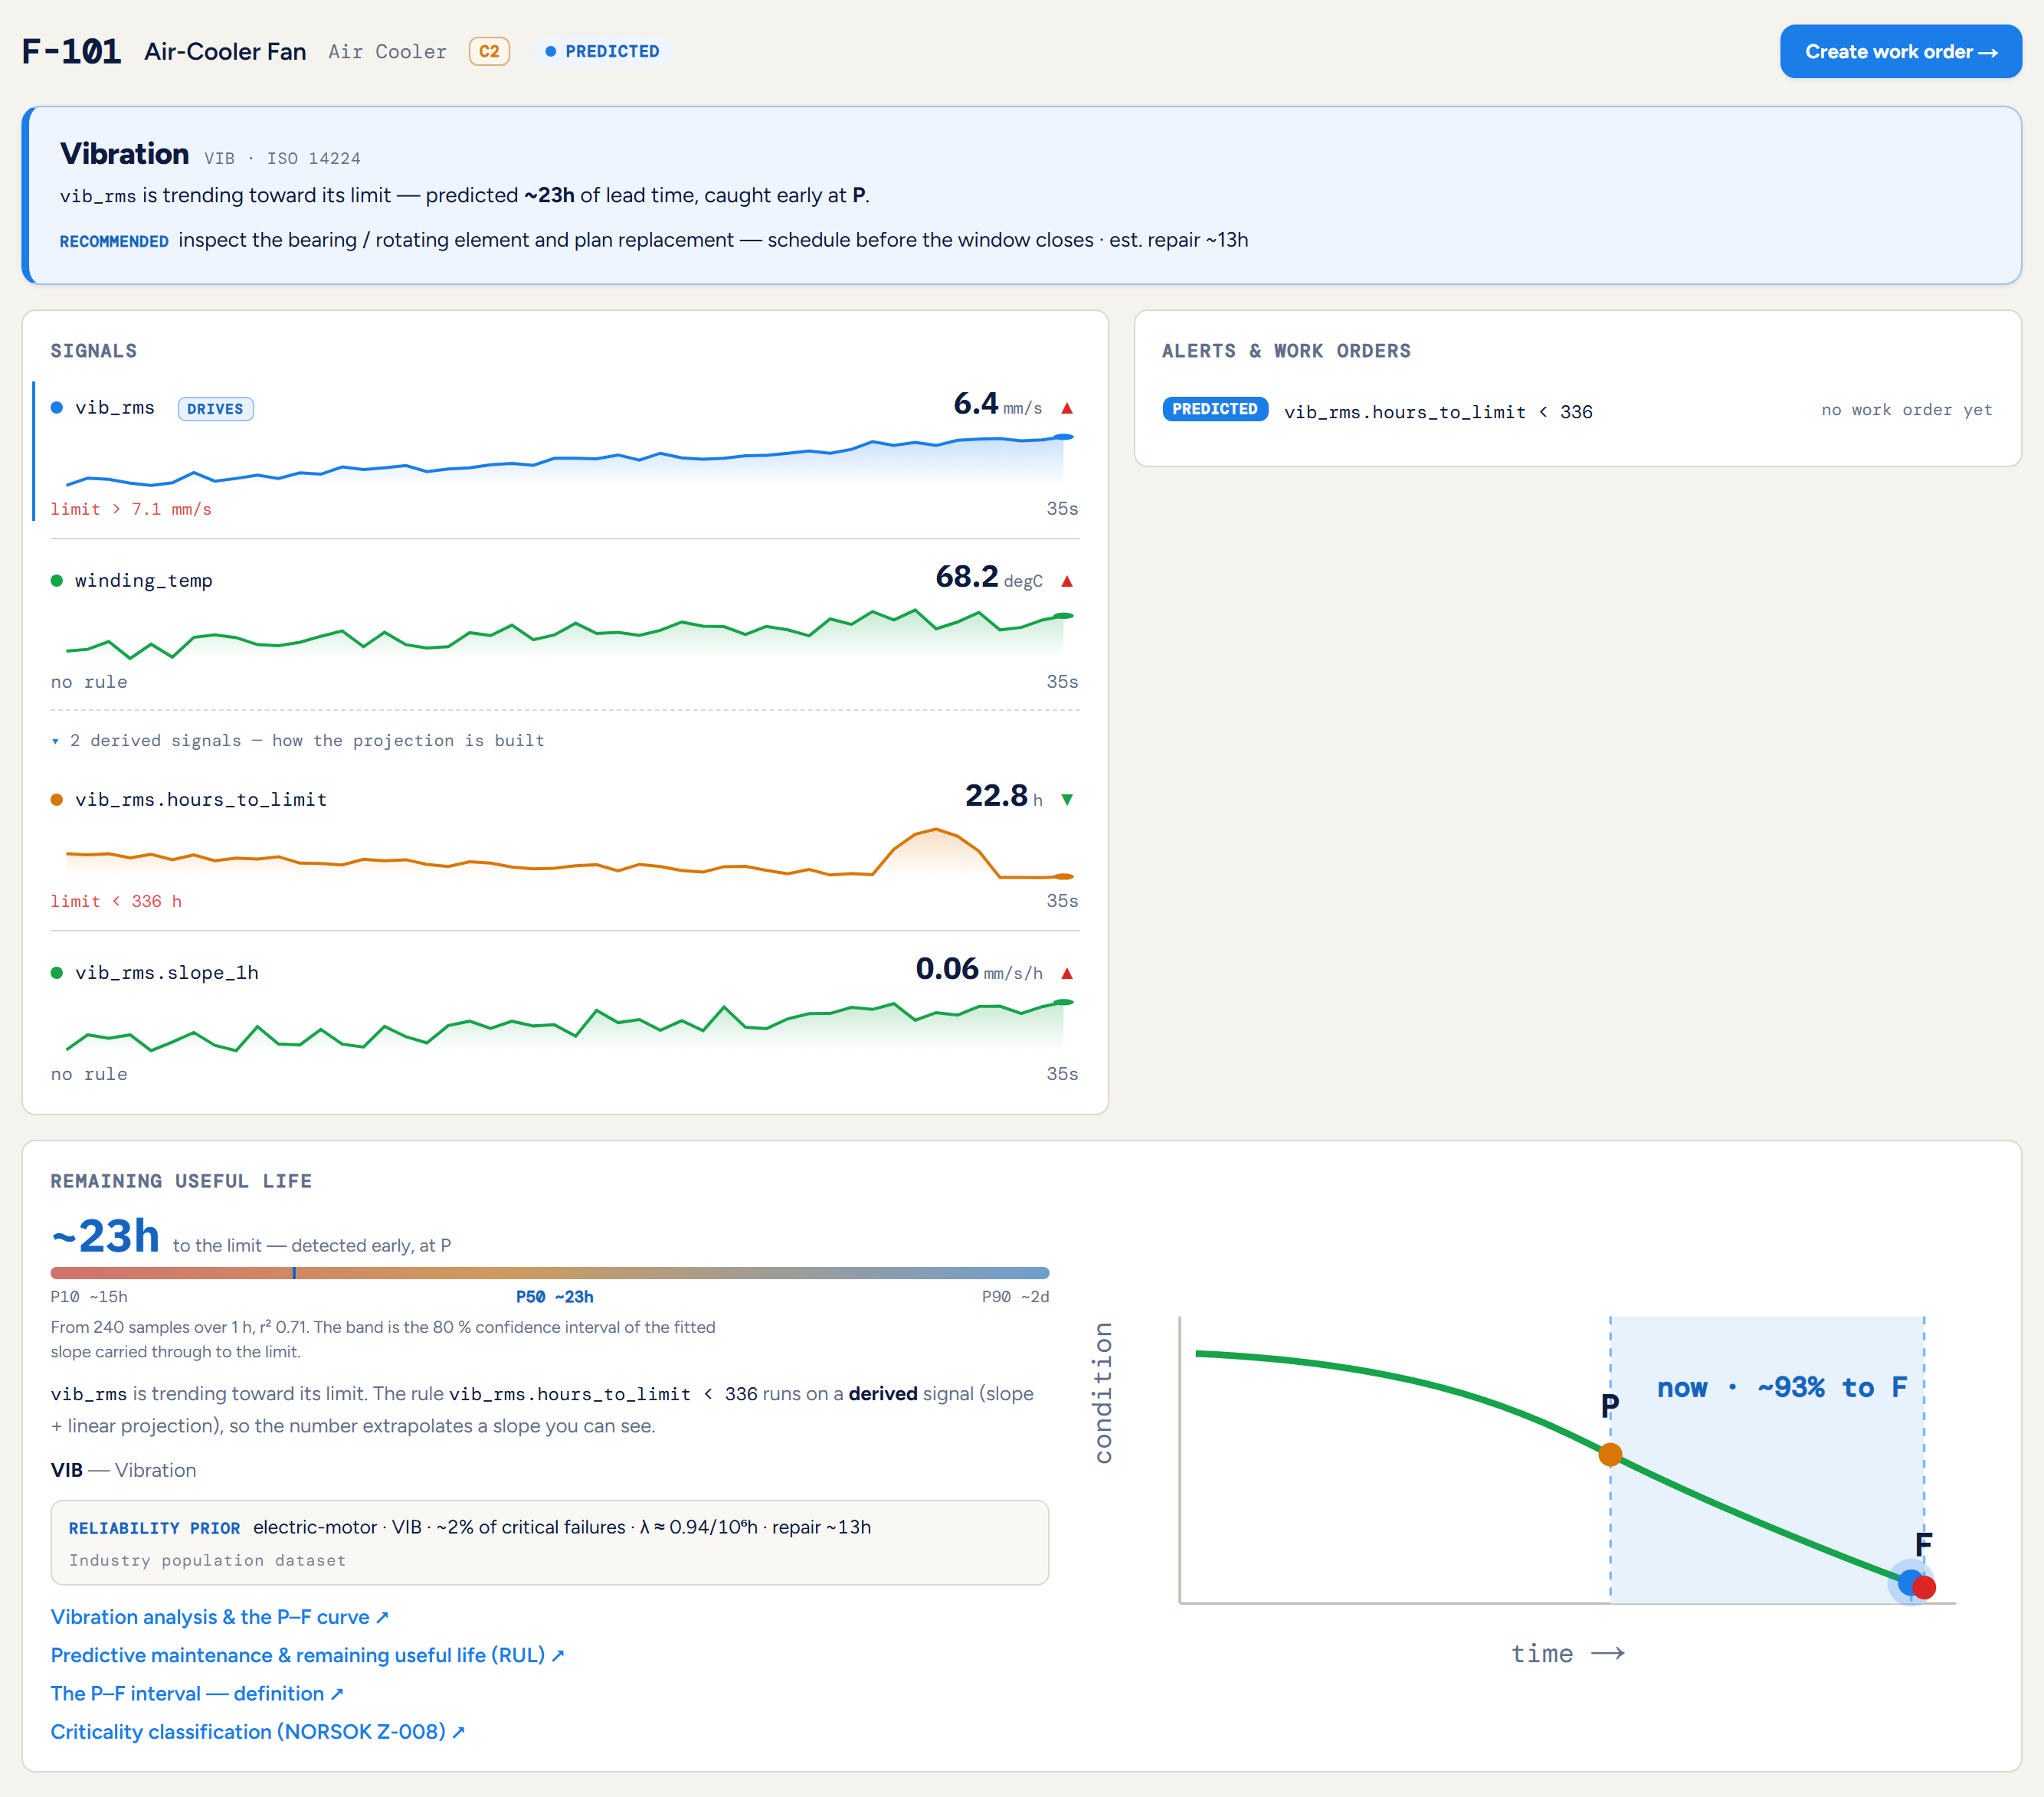
vib_rms at 6.4 mm/s against a 7.1 mm/s limit, plus the derived hours_to_limit that drives the countdown. The remaining-life panel gives an honest range, not a single date. And the prior names the population it comes from — an industry failure-rate dataset for this equipment class, λ ≈ 0.94/10⁶h.Nothing there is a black box. A signal became a failure mode, the failure mode was checked against an industry base rate, the asset was placed on its P–F curve, and only then did a remaining-life number appear — carrying its own uncertainty.
ISO 14224 names the failure mode, industry reliability data supplies the population base rate and repair effort, the P–F interval frames the lead time, and NORSOK Z-008 sets the criticality that ranks it.
Reading the P10–P90 band. The remaining-life figure isn't a single date — it is a range for when the signal reaches its limit. P50 (~23 h) is the central estimate. P10 (~15 h) is the early edge, and the one the platform proposes as the time to failure that sets the due date. P90 (~2 days) is the late edge; it reads open when the trend can’t be told apart from flat. These percentiles count from the early end, as a B10 life does; oil and gas reserves reporting counts the other way, with P90 as the low, conservative figure (DNV explains that convention) — so here, never plan on P90. The chip under the band names the method that drew it. Linear fit, as here, carries the uncertainty of the measured trend through to the limit — it is not a probability of failure, and on simulated runs the band held the true time only 20–28 % of the time, so the date it proposes is one a person confirms. Prior → posterior combines the population failure rate with the machine’s own trend into a failure-time distribution; on the same simulated runs its 80 % band held the true time about 80 % of the time. See Predictive Maintenance & RUL for how the band is built, and Weibull’s B10 life for the population version of the same idea.
One tap to a work order
"Create work order" opens a job that already knows why it exists — pre-filled with the asset, failure mode, criticality, remaining life and the population repair estimate — plus a checklist scoped to that specific failure mode. Print it for the technician, or push it to the CMMS.
VIB — Vibration · ISO 14224
C2 · NORSOK Z-008 · schedule before the window closes
RUL ~23h · ~93% through P–F · repair ~13h (industry data)
The same maintenance intelligence behind the Work Instruction Generator in our Toolbox builds that checklist — each step tied to the failure mode, with acceptance checks and hazard callouts. One vocabulary, both products.
Under the hood: what makes the answers trustworthy
Nothing on screen is a black box, and that is a design constraint rather than a claim. Six choices carry it:
A small edge service normalises OPC UA, Modbus, MQTT and I²C into one contract, so any sensor — new or already installed — feeds the same pipeline.
A population failure-rate prior gives a credible remaining-life estimate on day one, then sharpens with live trend as evidence accumulates.
A close-coupled pump body and its motor driver draw on separate reliability records — the granularity ISO 14224 defines and most tools flatten away.
Each prediction cites a failure mode, a base rate and a P–F position — an audit-grade rationale, not a post-hoc gloss on a score.
Findings become work orders in Microsoft Dynamics 365 or your own CMMS, ranked by NORSOK criticality and hours-to-limit.
Every alert links to a plain-English explainer of the standard behind it — you are reading one now.
The through-line: every number on the screen can be traced to a reliability standard. That is what lets Bluestream be explainable and hardware-agnostic at once — the combination the rest of the market leaves open.
What it monitors — and where it fits
Industry reliability data and ISO 14224 are richest on rotating machinery, so that is where a standards-grounded prior is strongest and where the platform starts.
Typical failure modes: bearing degradation, imbalance, misalignment, looseness, winding and insulation deterioration, cavitation, fouling, seal wear.
✓ A good fit if…
- You have rotating equipment with existing instrumentation — or somewhere sensible to add one sensor.
- Failures are gradual and have a detectable P–F interval (bearings, imbalance, fouling, wear).
- You already run a CMMS and want work orders to land there, not in another portal.
- You care why a prediction was made, because someone will have to justify the shutdown.
- You want to keep your sensor and CMMS choices open rather than being locked to one vendor.
✗ Not a fit — yet
- Sudden, random failures. If there is no detectable degradation before failure, no predictive method helps — including this one.
- No data at all. The platform needs a signal. If an asset is entirely uninstrumented and unreachable, start elsewhere.
- Instant precision on day one. A prior gets you started; calibration sharpens as your own data accumulates.
- A replacement for your CMMS. It feeds yours; it is not trying to be it.
- A hardware sales pitch. The starting assumption is always that we use what you already have. We can supply and install sensors where an asset genuinely needs them — but that is a service, not the business model, and never a condition of using the platform.
Reliability engineers have been oversold to for twenty years. Naming the boundary is faster than discovering it three months into a pilot — and it is the quickest way to tell whether this is worth your meeting.
Where this is going
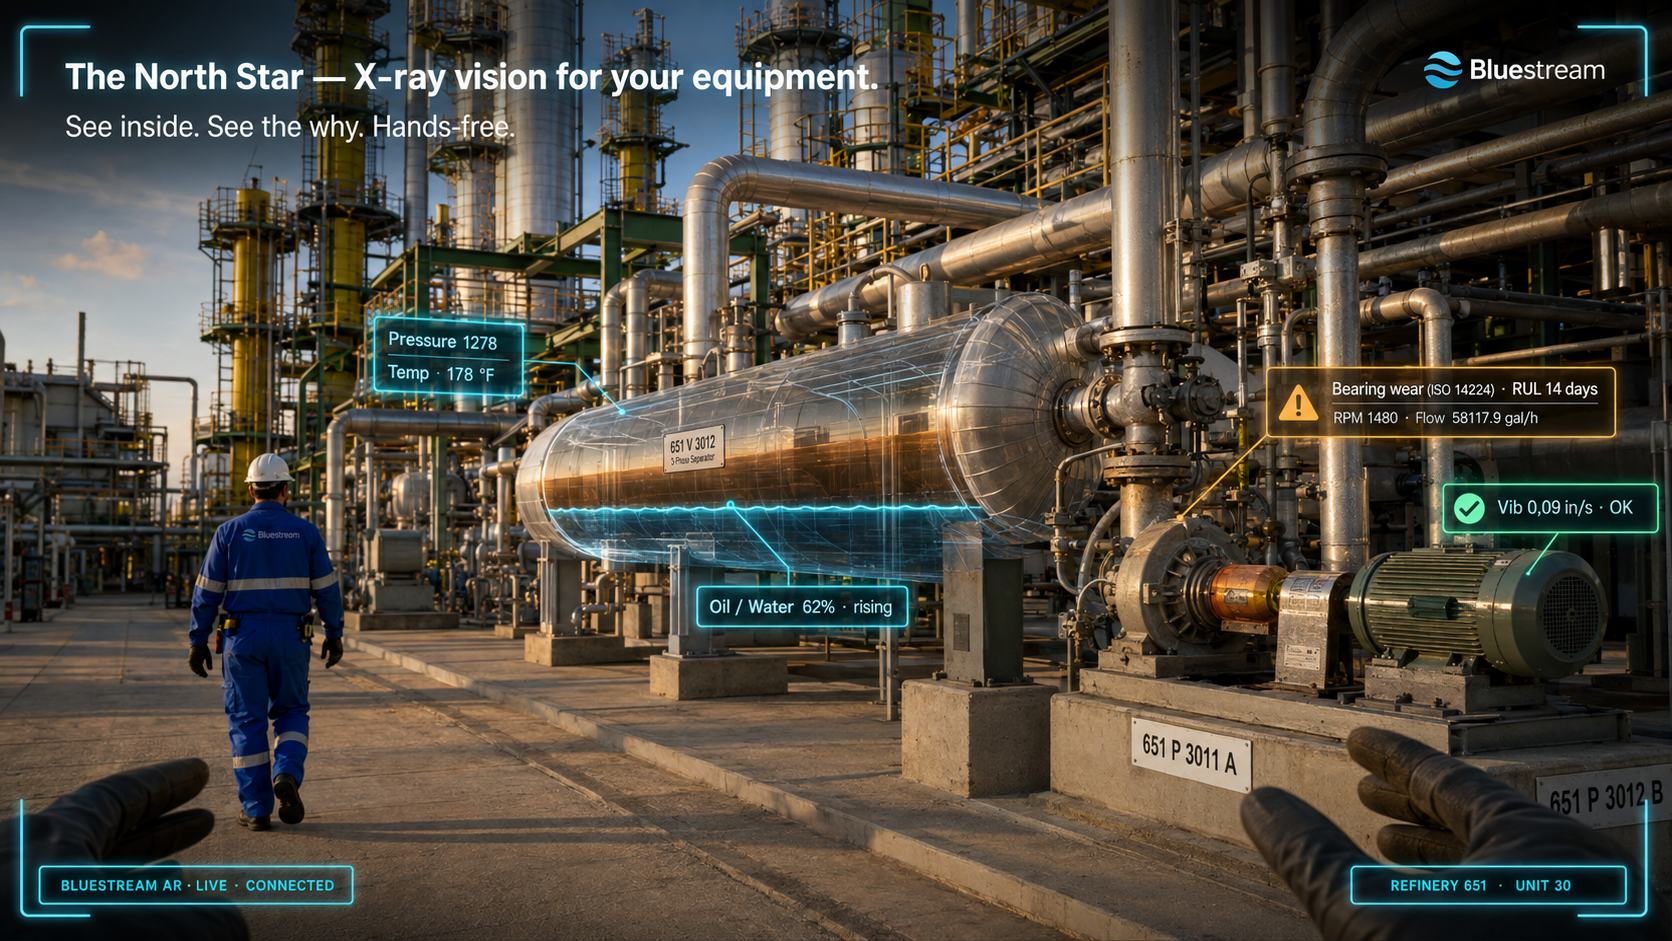
What runs today is the first horizon of a longer arc. Each stage deepens the same contextualised, standards-grounded data layer — which is precisely what an augmented-reality field layer needs underneath it before any overlay can be trusted.
Explainable RUL and the right work order out.
You are hereEvery reading tied to item, standard, position and history.
The graph bound to 3D geometry and plant layout.
The twin overlaid on the real asset, hands-free.
AR as the default interface for field O&M.
Practical questions
Do I have to buy your sensors?
OPC UA, Modbus, MQTT or I²C, or from your historian — and it is never tied to a particular vendor's kit. Where an asset genuinely has no useful signal, a single added sensor is usually enough. We can supply and install that hardware if you want us to, or you can buy it from whoever you like; the platform does not care either way.