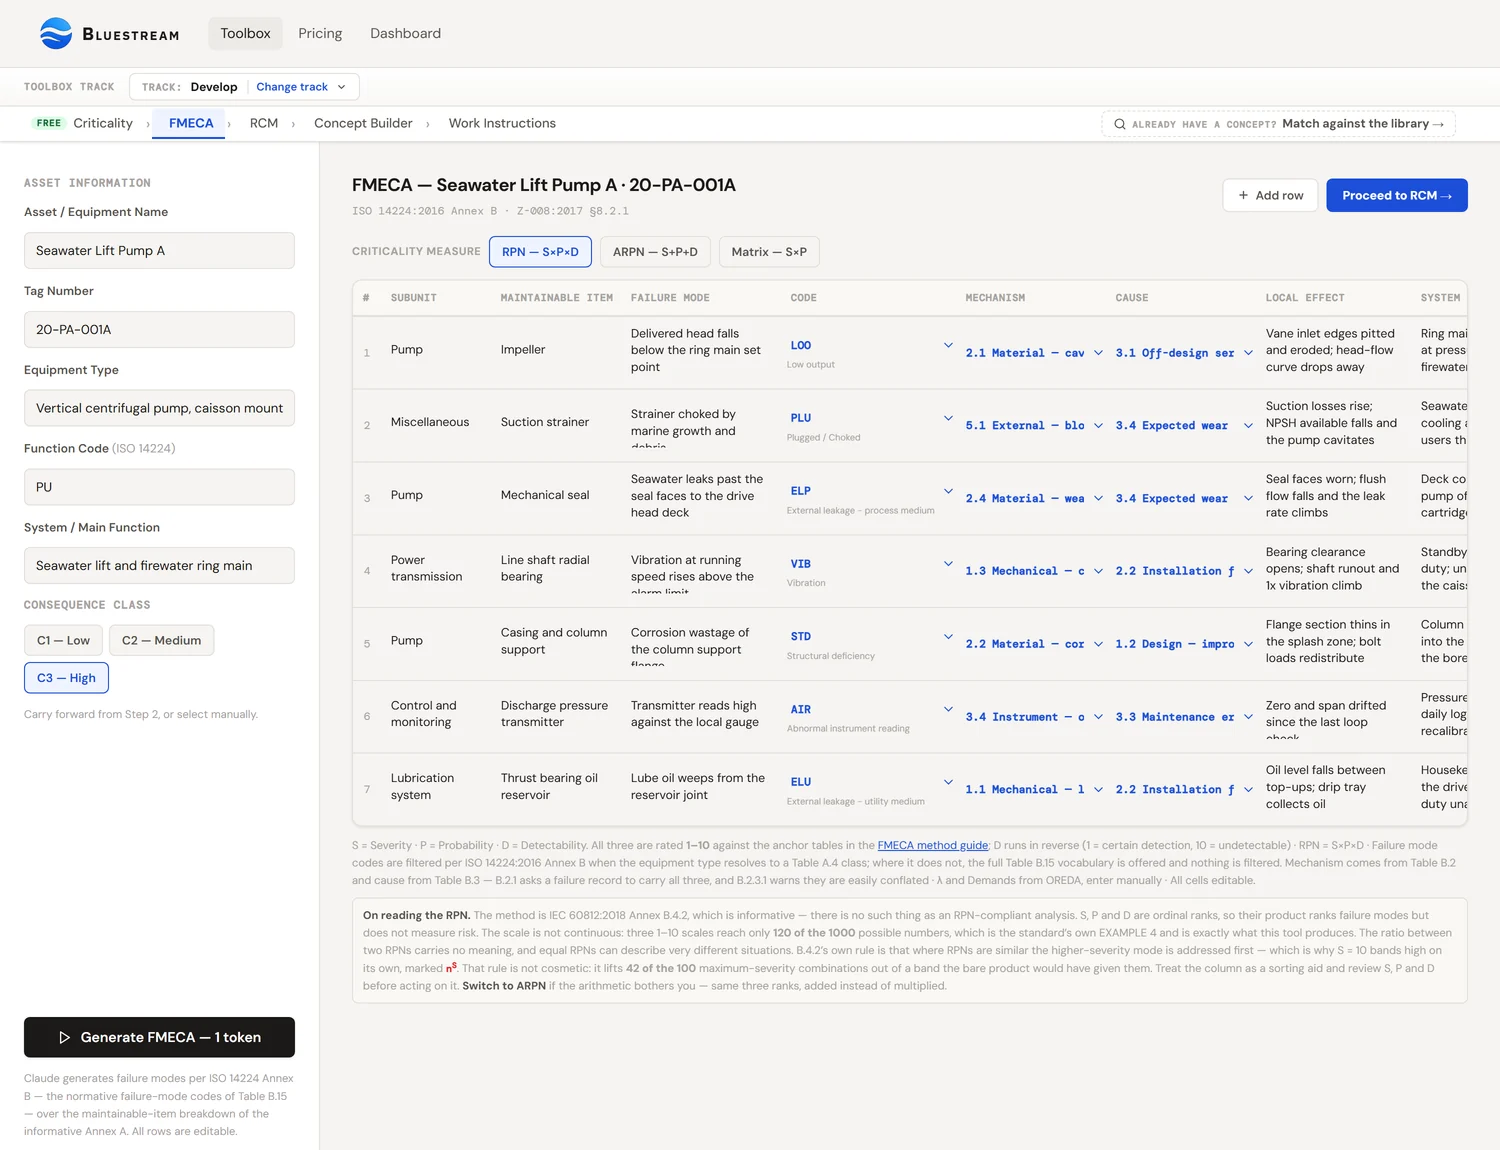
FMECA is the structured analysis that identifies every credible failure mode for an asset, describes its local and system effects, and scores it for risk. Bluestream defaults to the RPN method — Risk Priority Number = Severity × Probability × Detectability — with each scale rated 1-10. A risk matrix alternative using Severity × Probability only is also supported for applications where detectability is not meaningful.
The output is a ranked list of failure modes with treatment recommendations. That ranked list is the direct input to the RCM decision tree (Tool 3) — every failure mode in the FMECA becomes one input row to RCM, and the severity category drives the consequence branch of the RCM logic.
What FMECA is
FMECA is a bottom-up analysis that asks three questions for every item in a system: what can fail (failure mode), what happens if it does (effects), and how bad is that combination relative to everything else the system can do (criticality). The output is a table — one row per failure mode — that becomes the foundation of the maintenance programme.
The method is genuinely old. MIL-STD-1629A codified it in the US military in 1980, SAE J1739 formalised it for the automotive industry in 1994, and IEC 60812:2018 is the current international standard. Every reliability-engineering framework — RCM, RBM, RBI, FMEA-MSR, RAMS — uses FMECA (or its parent method FMEA) as its input layer.
What FMECA is not: it is not a risk assessment of the facility, it is not a hazard analysis (that's HAZOP), and it is not a reliability prediction (that's RBD, FTA, or Monte Carlo RAMS work). It is a structured inventory of failure modes with a risk score attached to each, and that narrow focus is what makes it tractable for thousands of failure modes across a production facility.
Inputs to FMECA: the criticality classification from Tool 1 (which assets deserve the analysis at all), the asset's operating context, the functional failure definition, and — ideally — historical failure data from OREDA, vendor bulletins, and the facility's own CMMS. The Bluestream tool populates failure-mode candidates automatically from the FMECA library so assessors don't start from a blank page.
Why it matters — the quantified handoff from criticality to RCM
Tool 1 (Criticality Classification) gave you the dominant class per asset — C1, C2, or C3 — which governs how much effort to spend on each asset. Tool 3 (RCM) will tell you what maintenance task to apply to each failure mode. FMECA is the bridge: it enumerates the failure modes and rates each one, so the downstream task-selection logic has something concrete to work on.
Concretely, FMECA produces three things that RCM needs:
- A list of credible failure modes — one row per failure mode, grouped by item and function.
- A consequence rating per failure mode — not just the asset-level dominant class, but the specific severity of each individual failure mode.
- A detectability assessment — which determines whether hidden failures are present, and whether the P-F interval concept is even applicable.
Skip FMECA and the RCM tool has nothing to analyse. Do FMECA poorly and RCM generates credible-sounding tasks for the wrong failure modes. The quality of everything downstream — inspection intervals, spare-parts strategy, workforce sizing, turnaround scope — anchors to how seriously the FMECA was done.
FMEA vs FMECA — the "C" is what changes
The terms are often used interchangeably in casual conversation, but the distinction is real and worth keeping straight.
| Method | What it does | Output |
|---|---|---|
| FMEA Failure Mode and Effects Analysis |
Identifies failure modes, describes their local and system effects. | A narrative table: one row per failure mode, describing what happens. No ranking. |
| FMECA Failure Mode, Effects, and Criticality Analysis |
Everything FMEA does, plus a quantitative or semi-quantitative criticality ranking. | A ranked table: failure modes ordered by risk. RPN, risk matrix cell, or criticality number. |
The "C" is the ranking. Without it, an FMEA is descriptive — useful for design review, useful for training, but not actionable for prioritising maintenance effort across a large population of failure modes. The criticality ranking is what makes the method scale from "here are the failure modes" to "here are the failure modes you should care about first."
The Bluestream tool produces FMECA output — every failure mode gets an RPN score (or risk-matrix cell if you use the matrix variant), and the results are sortable by risk. If you want just the FMEA narrative without ranking, run the tool and ignore the RPN column; the analysis itself is the same.
System vs Design vs Process FMEA
The literature distinguishes three FMEA variants based on what's being analysed. Knowing which one you're doing matters because the scope of failure modes is different.
| Variant | Scope | Typical users |
|---|---|---|
| System FMECA | Failure of a system-level function: a pump train, a safety-instrumented function, a compression stage. | Reliability engineers, maintenance engineers, RAM analysts. |
| Design FMECA (DFMECA) | Failure of a new design element during development: a component not yet in service. | OEM design teams, product development. |
| Process FMECA (PFMECA) | Failure of a manufacturing or operational process step: a machining operation, a calibration procedure, a start-up sequence. | Quality engineers, process engineers, automotive (Tier 1 suppliers). |
Bluestream's FMECA tool is primarily oriented toward System FMECA — the variant used in operational reliability engineering for asset-intensive industries. You can run Process FMECA with the same tool by selecting the operation as the "item" and the process failure mode as the FM, but the underlying library and benchmarks are tuned for System-level rotating and static equipment failures.
The criticality methods
IEC 60812:2018 Annex B describes four criticality methods: the criticality matrix (B.3.2), the criticality plot (B.3.3), the risk priority number (B.4.2) and the alternative risk priority number (B.4.3). The Toolbox implements three of them — RPN, ARPN and the matrix — switchable on the same ratings. The choice turns on whether detectability belongs in the number at all: B.1 gives it to RPN and ARPN only, and the matrix leaves it out.
5.1 RPN method — S × P × D (Bluestream default)
The Risk Priority Number is the product of three 1-10 ratings:
- Severity (S) — how bad is the effect if the failure occurs.
- Probability of Occurrence (P) — how likely the failure is to occur over a defined period.
- Detectability (D) — inverse measure of how detectable the failure is before it causes the effect. Low D = easy to detect. High D = hard to detect. This inversion trips everyone up — more below.
RPN ranges from 1 (trivial, easy to detect) to 1000 (catastrophic, inevitable, undetectable). The multiplicative structure is the point: a failure mode only reaches a high RPN if all three dimensions are bad. A severe failure that is common and undetectable is a different beast from a severe failure that is rare and obvious — the first demands immediate action, the second may be acceptable with a monitoring task.
RPN is the dominant scoring method in automotive (per SAE J1739) and in most asset-reliability applications where failures can be detected before they occur. It is the method the RCM decision tree assumes when asking "can we detect this failure in time to prevent the consequence?"
5.2 Risk matrix method — S × P only
The risk matrix method drops the detectability dimension and scores failure modes on severity × probability only. The result is a 2D cell reference (often 5×5, sometimes 3×3 or 4×4) that maps to a risk band: low / medium / high / intolerable.
The matrix variant is dominant in process industries — IEC 61511 safety-instrumented systems, process-safety event analysis, and most HAZOP/LOPA work. It is also the default in NORSOK Z-008 Annex C Table C.1 (which is itself a consequence-category matrix, not an FMECA matrix, but the underlying logic is identical).
5.3 Choosing between them
Use the RPN method when:
- The failure modes are physical degradation processes with detectable precursors (vibration, temperature, oil condition, dimensional change).
- Condition-based maintenance is a credible response to at least some of the failures.
- You want numerical ranking so you can threshold action (e.g., "all RPN ≥ 120 trigger review").
Use the risk matrix when:
- The failure modes are instantaneous or binary (valve fails closed, sensor gives spurious trip) and detectability is not meaningful.
- You are integrating with a broader process-safety framework (LOPA, SIL studies, HAZOP) that already uses an S × P matrix.
- The facility's risk decision criteria are defined in matrix form per NORSOK Z-008 §5.4.
Don't mix methods in the same FMECA. If you start with RPN and switch to matrix halfway through the analysis, the rankings are no longer comparable. Pick one per study. If the facility has assets that genuinely need both treatments, run separate FMECAs and document the method choice for each.
The scales
The 1-10 scales are where most FMECAs get loose. The scores are not arbitrary — they should anchor to concrete thresholds the assessor can point to. The Bluestream tool uses the anchoring described below. The 1-10 ordinal form is the one IEC 60812:2018 B.4.2 describes for RPN; the anchor wording itself is ours, written for oil-and-gas context, and is not a reproduction of any standard's table.
6.1 Severity (1-10) — rating effects, not causes
Severity rates the effect of the failure on the system, assuming the failure occurs. It does not rate the failure mode itself — the failure mode is the how; the effect is the what happens next. This distinction is the single biggest source of inconsistency in FMECA scoring.
| Rating | Meaning | Anchor |
|---|---|---|
| 10 | Catastrophic | Loss of life; major environmental release; destruction of the facility. Barrier defeat under major accident hazard. |
| 9 | Critical | Serious injury; regulated environmental release; loss of safety function; multi-day facility shutdown. |
| 7-8 | High | Injury requiring medical treatment; significant production loss; major repair cost; release below reporting threshold. |
| 5-6 | Moderate | Production reduction; minor repair; requires response within shift. |
| 3-4 | Low | Minor impact; acceptable performance degradation; routine repair. |
| 1-2 | Negligible | No operational consequence; customer-unnoticeable; invisible to operations. |
Severity anchors should match your Z-008 consequence classes
If the asset is C3 under NORSOK Z-008, at least one failure mode on it should rate Severity ≥ 7 — otherwise the criticality classification and the FMECA disagree, and one of them is wrong. The Bluestream tool surfaces this inconsistency as a warning when you save.
6.2 Probability / Occurrence (1-10)
Probability rates how likely the failure mode is to occur over a defined time period — typically per year of operation for operational equipment, per demand for safety-instrumented functions.
| Rating | Meaning | Anchor (per year) |
|---|---|---|
| 10 | Almost certain | > 1 failure per year — routine occurrence. |
| 8-9 | Frequent | 1 per 1-3 years. |
| 6-7 | Occasional | 1 per 3-10 years. |
| 4-5 | Remote | 1 per 10-30 years. |
| 2-3 | Very remote | 1 per 30-100 years. |
| 1 | Improbable | < 1 per 100 years; no historical precedent. |
Anchoring the probability to a per-year rate forces the assessor to look at data rather than gut feel. For oil-and-gas equipment, OREDA data gives λ in failures per 10⁶ operational hours; divide by the annual hours of operation and you have a per-year rate that maps to the scale above.
6.3 Detectability (1-10) — the scale people get wrong
Detectability is inverted relative to the other two scales. Low D means the failure is easy to detect. High D means the failure is hard to detect. This is the single most common FMECA scoring error — assessors treat D like S and P, giving a 10 to something they think is "highly detectable", which then under-scores its actual risk.
| Rating | Meaning | Anchor |
|---|---|---|
| 10 | Undetectable | No practical means of detection before the failure manifests. Hidden failures on safety-instrumented functions without proof testing. |
| 8-9 | Very low detectability | Only detected by specialist test or destructive inspection. Proof test interval equals installation life. |
| 6-7 | Low detectability | Detected only by detailed inspection at PM intervals. No online monitoring. |
| 4-5 | Moderate detectability | Routine inspection detects it with reasonable reliability. Oil analysis, thickness measurement. |
| 2-3 | High detectability | Continuous or very frequent detection. Vibration monitoring, temperature trending, process alarms. |
| 1 | Certain detection | Failure is immediately obvious on occurrence (loud noise, spray, alarm). Operator cannot miss it. |
Detectable is not the same as evident. An evident failure announces itself to the operator when it occurs (noise, alarm, visible leak). A detectable failure can be found before it occurs (vibration trend, temperature rise). A failure can be detectable but not evident — vibration monitoring catches the bearing degradation before the bearing seizes; the seizure is evident, the degradation is detectable. The D scale is about detecting the precursor, not the failure itself. See P-F interval in the glossary.
RPN interpretation & action thresholds
RPN is a number between 1 and 1000, but not every point on that scale carries equal meaning. IEC 60812 sets no thresholds at all — B.4.2 Note 3 observes only that some applications treat any RPN above a defined limit as unacceptable while others act on high severity regardless of the product. The bands below are therefore a Bluestream default, not a requirement of the standard, and you are free to set your own. They are the three the tool colours, and ARPN and the criticality matrix use bands calibrated to agree with them so switching method does not silently re-rate your register:
| RPN band | Classification | Typical treatment |
|---|---|---|
| 1 – 60 | Low | No action on RPN grounds. Run-to-failure is acceptable if operationally tolerable. |
| 61 – 199 | Medium | Preventive or condition-based task. Reassess once you have data — this band covers everything from "watch it" to "must not run to failure". |
| ≥ 200 | High | Not acceptable by maintenance alone in most contexts. Expect a redesign, a barrier upgrade or a procedural control. |
| S = 10 | High, on severity alone | Banded high whatever the product says, and marked with a superscript S in the tool. See the note below. |
Don't let RPN drive action alone. A failure mode with Severity 10, Probability 1, Detectability 1 has RPN = 10 — which the band above calls "acceptable". That's dangerous reasoning for a catastrophic failure. Any Severity ≥ 9 failure mode should be reviewed regardless of RPN, because the consequence of being wrong about the probability or detectability is unacceptable. The tool enforces this rather than leaving it to discipline: Severity 10 bands high on its own, whatever the product works out to, and the value carries a superscript S so a reviewer can see the floor did the work. Across the full rating space that rule lifts 42 of the 100 maximum-severity combinations out of the band the bare product would have given them — including the S10/P1/D1 case above, which the arithmetic calls 10.
Criticality ranking alternatives
RPN and the risk matrix are the two mainstream methods, but they are not the only ones. For legacy or regulatory reasons, you may encounter:
8.1 Criticality matrix
A 2D matrix identical in structure to the risk matrix above but specifically labelled as "criticality" rather than "risk". Common in military and aerospace, where MIL-STD-1629A is the usual reference (a standard we do not hold, so we do not quote it). This is the same construct as the criticality matrix the Toolbox implements from IEC 60812:2018 B.3.2 — the terminology differs, the logic does not.
8.2 Criticality number (MIL-STD-1629A quantitative)
A fully quantitative score computed as Cm = β × α × λp × t, where β is the conditional probability of the failure effect, α is the failure mode ratio, λp is the item failure rate, and t is the operating time. Each failure mode gets a numerical criticality contribution; the sum across all failure modes of an item gives the item's criticality number.
The method is more rigorous than RPN but requires high-quality input data (failure rate λp, mode ratios α) that most operating facilities don't have. It is still used in aerospace and nuclear applications where the data infrastructure supports it. The Toolbox does not compute Cₜ, and the RPN column is calculated rather than editable, so there is nowhere to paste one in. What the tool does capture is the input the method needs: the λ and Demands columns take OREDA failure rates per row. IEC 60812:2018 B.4.3 Note 2 makes the same point in the other direction — where you hold real quantities for all three parameters, calculate the risk from those rather than banding them into ordinal scales at all.
ISO 14224 failure-mode taxonomy
ISO 14224:2016 defines a standard taxonomy for failure-mode coding across the petroleum and natural gas industries. The standard provides:
- An equipment classification hierarchy (equipment class → equipment type → equipment subunit → maintainable item).
- A closed list of failure modes for each equipment type — pumps, compressors, heat exchangers, valves, instrumentation.
- A failure-mechanism taxonomy — corrosion, fatigue, erosion, electrical malfunction, control malfunction.
- A failure-cause taxonomy distinct from the failure mode.
Why this matters for FMECA: without a standard taxonomy, every assessor invents their own failure-mode vocabulary. "Bearing failure" means different things to different people; "bearing - inner race spalling - fatigue" is unambiguous. ISO 14224 gives you the unambiguous version.
The Bluestream tool's FMECA library uses ISO 14224 failure-mode codes as the default vocabulary. When you select a pump in the asset classification (equipment class PU), the tool presents the ISO 14224 Table B.6 failure modes as the starting list — external leakage, internal leakage, fail to start on demand, vibration, noise, overheating, and so on. You can add custom failure modes, but the ISO-coded ones stay linked to the taxonomy for benchmarking against OREDA and vendor data.
ISO 14224 integration with the CMMS is the real win
Coding failure modes consistently in FMECA is good. Coding them consistently in the CMMS over years of operation is transformative — it turns work-order history into usable reliability data. The FMECA and the CMMS failure-code library should use the same ISO 14224 codes. If they don't, reconciling FMECA predictions against actual failure history becomes an archaeological exercise.
FMECA → RCM: what flows through
The FMECA output feeds the RCM decision tree (Tool 3) one failure mode at a time. Every row in the FMECA table becomes one input row to RCM, carrying the following fields:
| FMECA field | Used by RCM for |
|---|---|
| Failure mode description | Identity — the RCM decision applies to this specific FM. |
| Local effect | Determines whether the failure is evident or hidden. |
| System effect | Determines the consequence category branch (safety / environment / operational / non-operational). |
| Severity score | Confirms the consequence category; triggers the "is it safety-related?" question in the RCM tree. |
| Probability score | Informs the age-reliability question (random vs age-related). |
| Detectability score | Informs whether condition-based maintenance is feasible (low D = CBM viable; high D = CBM not viable). |
| Recommended treatment (from RPN band) | First-pass task recommendation; RCM decision tree confirms or overrides. |
The Bluestream Tool 2 output is structured specifically to carry these fields into Tool 3 without re-entry. When you progress from FMECA to RCM in the platform, the FMECA result is the RCM input — not something you copy, something the tool passes forward automatically.
RCA → FMECA: closing the operate loop
FMECA is usually built once at the start of the maintenance program and frozen. That works until reality disagrees with it. When equipment fails for a mode you didn't list — or fails for a listed mode at a much higher rate than the FMECA predicted — the model is wrong and the program built on top of it inherits the same error.
The fix is reactive analysis feeding back into the proactive model. The Bluestream Operate track runs Root Cause Analysis on real failure events using 5-Whys, Fishbone, or Fault Tree Analysis per IEC 62740. The output is a defensible immediate / contributing / systemic cause structure, and a set of corrective and preventive actions.
Each confirmed root cause becomes a candidate FMECA update — either a new failure-mode row (the mode was missing from the original analysis) or an adjustment to an existing row (severity or probability proven wrong by the event). The Operate-track RCA tool pushes findings into the FMECA directly with one click, so the model stays current with the live failure history rather than drifting out of date.
The loop in one sentence: FMECA predicts what could fail and how often; RCA reports what actually failed and why; the RCA finding updates the FMECA so the next prediction is closer to the next reality.
How the Bluestream tool implements FMECA
Tool 2 on /toolbox is a failure-mode-by-failure-mode workflow. The sidebar lets you select the asset (carried forward from Tool 1 if you came through the sequence), and the main panel cycles through each failure mode in the ISO 14224 library for the asset's equipment type.
For each failure mode, the tool asks four questions:
- Is this failure mode credible for this asset's operating context? If not, skip it — not every Table B failure mode applies to every installation.
- What is the Severity? Pick 1-10 using the anchor table; a brief rationale is recorded.
- What is the Probability? Pick 1-10; where you hold a published failure rate for the item, enter it in the λ column so the rank is anchored to data rather than judgement alone.
- What is the Detectability? Pick 1-10 using the inverted scale; the tool warns if the score disagrees with the "detection method" free-text field.
Click Score FMECA to consume 1 token and produce the ranked output. The output shows every failure mode with its S/P/D scores, the computed RPN, the treatment band, and any inconsistency warnings (Severity disagrees with criticality class, Detectability disagrees with detection-method text, Probability disagrees with the failure rate entered in the λ column). The ranked table exports to the RCM tool for task selection.
Worked examples
Three failure modes showing how the S/P/D scoring lands differently depending on the asset and its context.
Example 1 — Centrifugal pump bearing wear (classic CBM candidate)
RPN 72 · MonitorAn oil-and-gas produced-water injection pump — continuous duty, 500 m³/hr, API 610 OH2. Failure mode: abnormal vibration from rolling-element bearing degradation (ISO 14224 code: VIB). Note the distinction the standard draws — wear is the failure mechanism (Table B.2); the failure mode is what you observe at the equipment, which here is vibration. There is no WEAR code. The pump is in a 2×100% arrangement; the operating context is offshore platform, RED-B redundancy.
Probability (P) = 4 — published reliability data for pumps of this service gives λ = 14 per 10⁶ hours for bearing failure; ~1 per 8 years per pump. Remote category.
Detectability (D) = 3 — Online vibration monitoring on this pump. Bearing defect frequencies are trended continuously; warning triggers at defined amplitude thresholds, weeks before failure. High detectability.
RPN = 6 × 4 × 3 = 72
Treatment band: Monitor.
Recommended task: Continue vibration-based CBM; no additional action.
This is the canonical CBM case. Moderate severity, low probability, high detectability — the low D makes the RPN tractable. Notice that without the vibration monitoring (D = 6-7 instead), the RPN would rise to ~150-170 and move into the mitigate band. The D score directly pays for the cost of the monitoring system.
Example 2 — PSV fails to lift on demand (hidden failure)
RPN 270 · Redesign/FFA pressure safety valve on a separator — spring-loaded PSV sized per API 520, protecting against blocked-outlet overpressure. Failure mode: fails to lift at set pressure on demand (ISO 14224 code: FTO). The PSV is the last barrier against vessel overpressure; no upstream protection except the operator-response alarm.
Probability (P) = 3 — PSV seat sticking or spring relaxation. The industry population rate for failure to open on demand is ~10⁻³ per demand, but the demand rate on the PSV is itself infrequent. Very remote.
Detectability (D) = 10 — This is a hidden failure. The PSV looks fine from outside; there is no routine monitoring that confirms it will lift at set pressure. The only detection is an actual demand event or a removal-and-bench-test. Undetectable in normal operation.
RPN = 9 × 3 × 10 = 270
Treatment band: Redesign.
Recommended task: Failure-finding task (scheduled function test / bench test) at interval determined by acceptable hidden-failure probability. Typical: 3-5 year interval for PSVs in hydrocarbon service.
The hidden-failure problem is the signature FMECA case. S and P are moderate; D pushes the RPN into redesign territory. The only maintenance response is a scheduled failure-finding task — there is no preventive task that addresses the failure itself, because the failure mechanism is sticking of parts that are not accessible during operation. Offline testing is the only option.
Example 3 — Mechanical seal fugitive emission (environment-dominant)
RPN 144 · MitigateA mechanical seal on a crude export pump — single-seal arrangement, API 682 Plan 11 flush. Failure mode: external leakage to environment below reportable threshold (ISO 14224 code: ELP — external leakage, process medium). The operator has public methane emission targets under Norway's climate commitments; fugitive hydrocarbon emissions count toward the facility GHG budget.
Probability (P) = 6 — Mechanical seals on hydrocarbon service have λ ≈ 40 per 10⁶ hours for external leakage; ~1 per 3 years. Occasional.
Detectability (D) = 3 — Optical gas imaging (OGI) surveys at 6-month intervals; acoustic monitoring on the seal vent line. Detectable with standard operator surveillance. High detectability.
RPN = 8 × 6 × 3 = 144
Treatment band: Mitigate.
Recommended task: Continue OGI surveillance; consider upgrade to API 682 Plan 52 dual-seal arrangement on next turnaround to reduce severity.
This example shows how the 2024 Z-008 revision (Environment split out from HSE) actually changes FMECA scoring. A failure mode that was RPN ~108 under the old framework (S = 6 for combined HSE) becomes RPN 144 under the new framework (S = 8 for Environment alone). The higher RPN justifies mitigation that was harder to justify when environmental consequence was lost in the HSE average.
Common pitfalls
Six FMECA errors that recur across projects. Most of them come from pressure to finish the analysis fast, which reliably produces output that looks like FMECA but fails its purpose.
1. Rating cause instead of effect in severity
Severity is the effect on the system, not the intrinsic "badness" of the failure mode. A shaft fatigue crack rates Severity based on what happens when the shaft breaks (partial trip, full stop, collateral damage to coupling and driver), not on how bad the fatigue itself sounds. Anchor to the effect description every time.
2. Conflating evident with detectable
An evident failure announces itself when it happens; a detectable failure can be found before it happens. The D scale is about advance detection — the P-F interval. A bearing seizure is evident (loud noise, motor trip), but undetectable in the sense that matters for FMECA scoring unless vibration monitoring is in place. Rate D on the availability and reliability of precursor detection, not on whether the failure itself is noisy.
3. Treating hidden failures as D = 5 because "we'll catch them at PM"
Hidden failures are D = 10 unless there is an explicit, scheduled test that exercises the function. Relying on "we'll notice at PM" is not a test — PM inspects the physical condition of the asset, not its function. If the failure is hidden and there is no functional test in the programme, the D score is 10 and the RPN will drive to redesign or failure-finding. Resist the urge to soften that.
4. Single-assessor FMECA
FMECA is usually a team method. IEC 60812:2018 5.2.6.2 requires competence, not a committee: “People with the technical competence and authority to perform the FMEA are required”, and achieving that “might require a multidisciplinary team approach, where composition of the team depends on the objectives of the analysis”. In practice that usually means operations, maintenance, reliability and someone who knows the design. A one-person FMECA reflects one person's blind spots and will miss failure modes that another discipline considers obvious. If the schedule only allows a single assessor, book a team review afterwards. A single-analyst FMECA is still an FMECA — the standard writes throughout about “the analyst” and makes facilitation skills conditional on the work being done by a team — but it reflects one person’s blind spots, and the review is where the failure modes another discipline finds obvious get added.
5. Scoring without failure history
Probability scores derived from intuition drift toward the middle of the scale (3-5). Scores anchored to actual failure rates — from OREDA, vendor bulletins, or CMMS history — are more defensible and spread more widely. Before the team scores Probability, someone should have pulled the relevant data. If the data doesn't exist, that is itself a finding — flag it in the output as "probability based on expert judgement, no benchmark available" so downstream users can discount it appropriately.
6. Letting RPN drive action alone
RPN multiplies three scales, so a zero in any dimension drives the product to zero. A failure mode with Severity 10, Probability 1, Detectability 1 has RPN = 10 — well inside the "accept" band — but its consequence is catastrophic. Every Severity ≥ 9 failure mode should be reviewed regardless of RPN. Bluestream surfaces these as a separate list, but reviewers must actually look at the list. The formula is not a substitute for engineering judgement.
References
- IEC 60812:2018 — Failure modes and effects analysis (FMEA and FMECA). The current international standard.
- SAE J1739:2021 — Potential Failure Mode and Effects Analysis (FMEA) including Design FMEA, Supplemental FMEA-MSR, and Process FMEA. The automotive-industry reference.
- MIL-STD-1629A — Procedures for performing a failure mode, effects and criticality analysis. The US military standard; cancelled in 1998 but still widely cited for the quantitative Criticality Number method.
- ISO 14224:2016 — Petroleum, petrochemical and natural gas industries — Collection and exchange of reliability and maintenance data for equipment. The failure-mode taxonomy source.
- NORSOK Z-008:2024 — Risk based maintenance and consequence classification. Provides the consequence-classification framework that anchors FMECA severity scoring for oil-and-gas applications.
- OREDA Handbook — Offshore and onshore reliability data handbook. Industry benchmark failure rates for probability scoring.